Super Ads 2025
Infographic for super bowl 2025 advertisements
The 2025 Super Bowl, beyond the game itself, is equally exciting for me as a strategic communications student—the ads during the Super Bowl are equally thrilling!
My infographic focuses on the 2025 Super Bowl ads—who do you think will win the game?
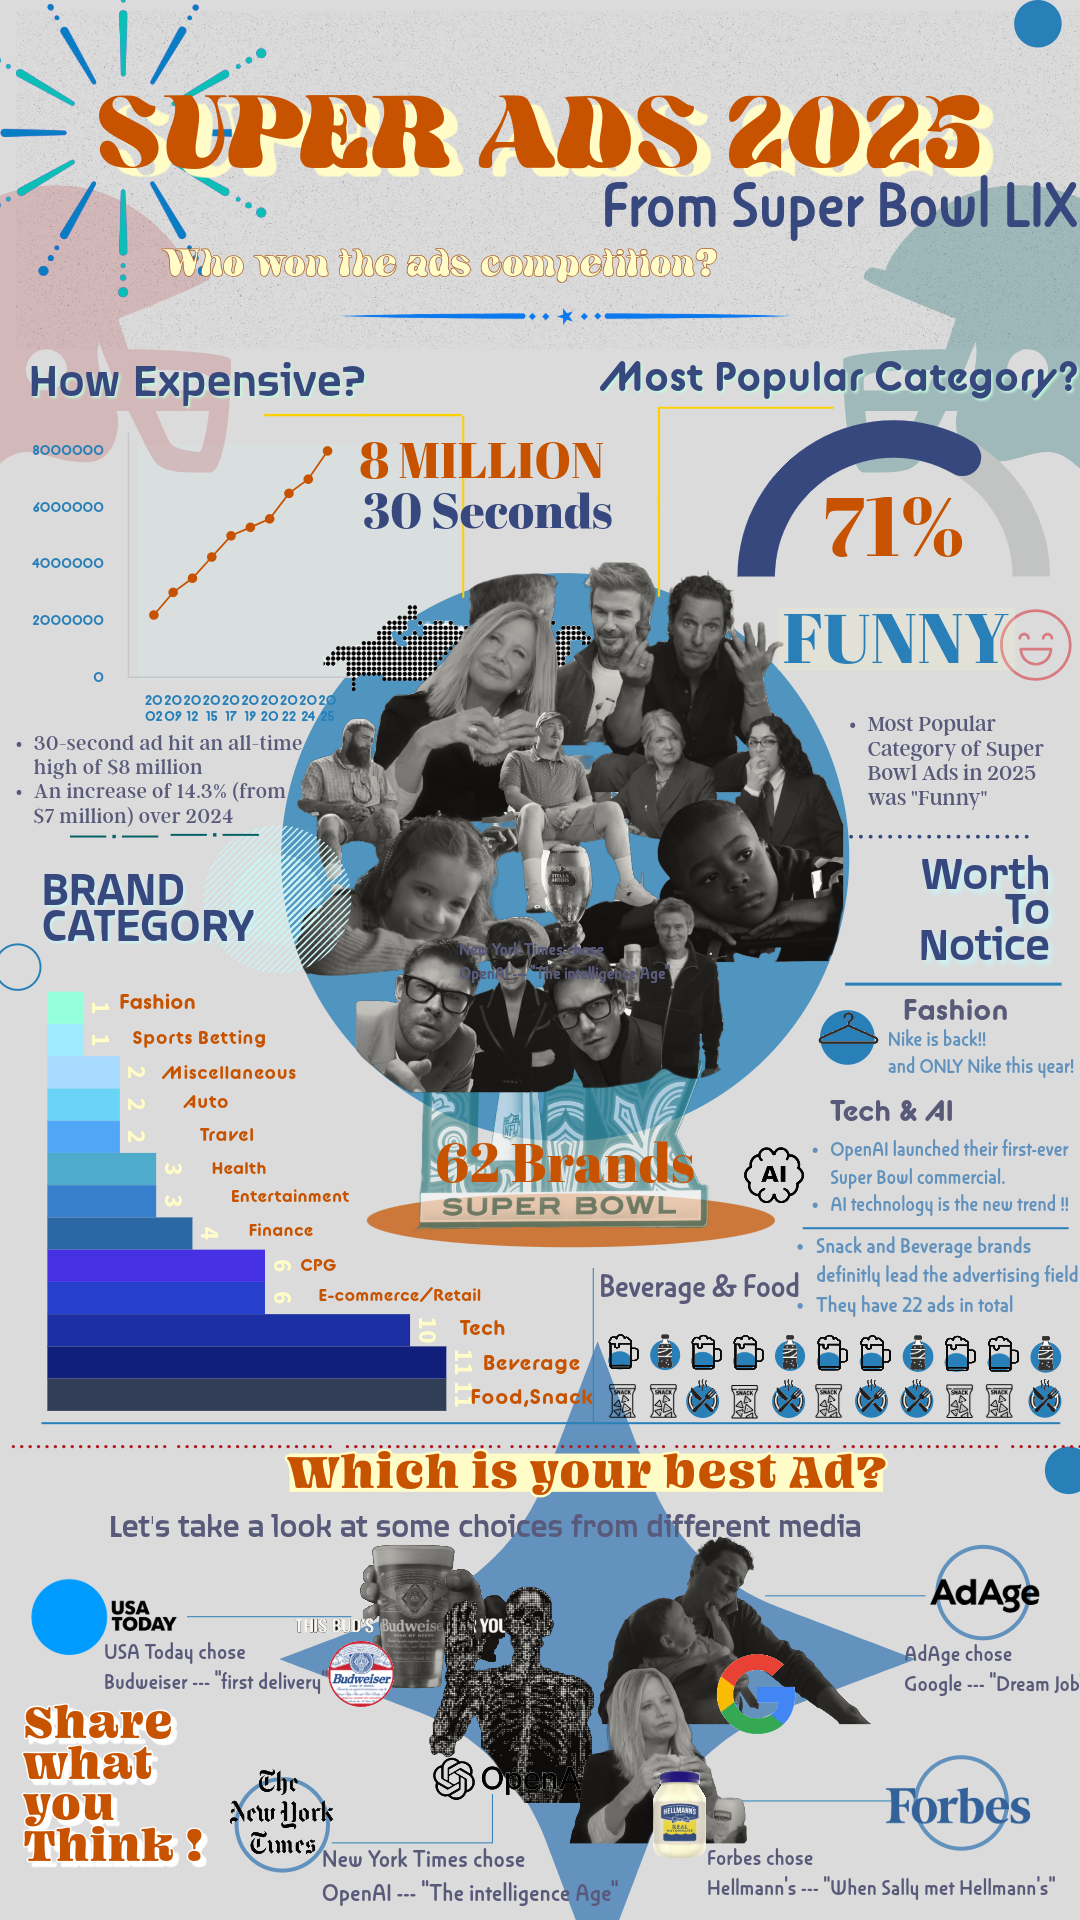
In the infographic, I use clear and concise data visualization to showcase the staggering advertising costs of the Super Bowl! Additionally, the infographic includes information on ad types, quantities, the most popular categories, and the media platforms that selected the best Super Bowl ads. My call to action is to encourage the target audience to discuss the 2025 Super Bowl ads—which one is your favorite?
Design
I used blue and orange as the primary colors, with gray as the background color, varying shades of blue as the main hues, and vibrant orange accents. The central part of the infographic—the blue circles—features screenshots of celebrities from different ads (also a key attention-grabbing element of the 2025 Super Bowl ads).
I utilized bar charts, pie charts, analogies, and lists for data visualization to present the results in the most direct manner. Data sources include Statista, Mintel, USA Today, AdAge, Forbes, and other reputable sources.
I used Adobe Express and PhotoShop created the whole infographic.
